For the past 30 years, companies have been offering pricing programs (fixed and capped) to give their customers peace-of-mind, maximize company sales margins and minimize customer attrition. The methods to offer caps have usually centered around a combination of Merc-related hedges, often locking in “supplier diffs,” and sometimes using physical inventory and/or weather hedges.
The key issue being hedged was generally the price of oil on the Merc, as everything seemed to flow from there. Basis differentials (the spread between the Merc and the price charged by suppliers) were always on the radar, but they were generally stable and were hardly anything that kept people awake at night—the “diffs” did move, but the movements were generally small, just the matter of a few cents per gallon in either direction.
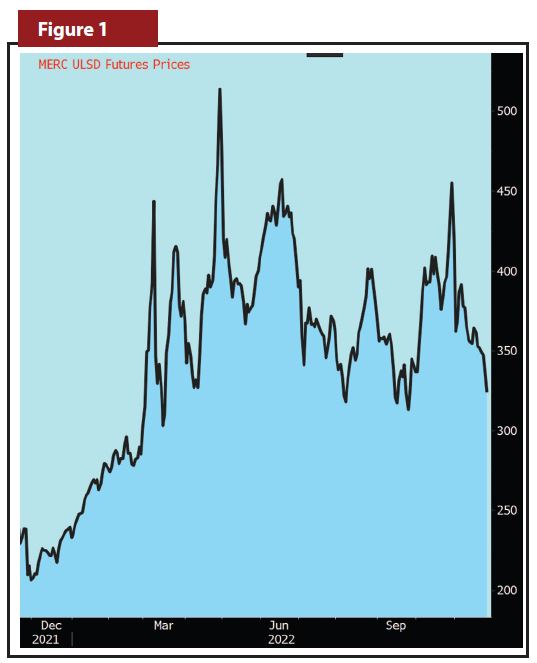
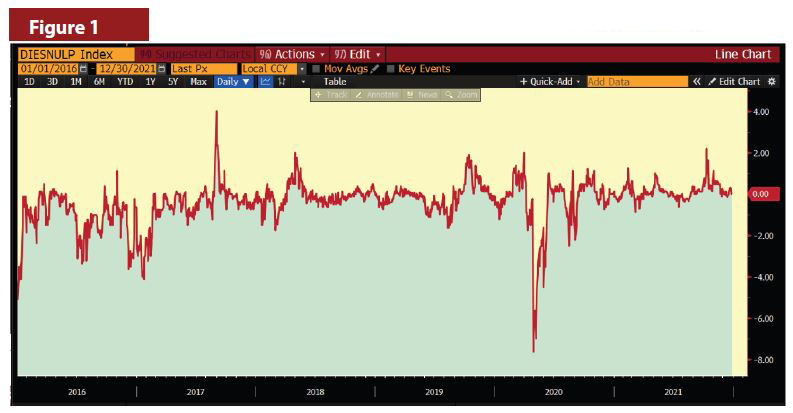
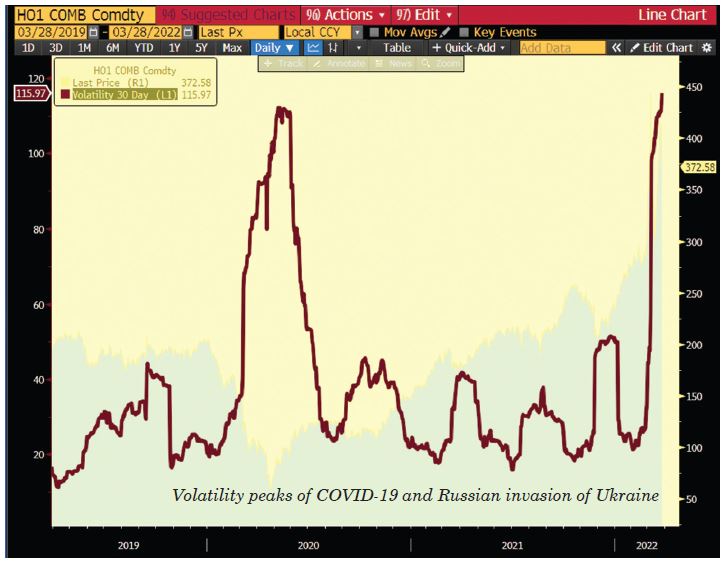
Last February, Russia did the unthinkable and attacked Ukraine. Since that time, the world’s economies have been in flux, the political landscape has become untethered and oil prices have overshadowed all markets (except for cryptocurrencies) in terms of volatility and unpredictability. ULSD futures prices went from a low of $2.00/gallon to a high of almost $6.00/gallon in the late Winter/early Spring—and then fell to $3.00/gallon and rose to $4.70/gallon in the Fall (see Figure 1).
That record-setting volatility drove hedging costs (options premiums) to record highs. Who wants to spend $.50/gallon to cap the price of oil? However, the real issue was not the Merc price or the high cost of Merc-related options. The real issue was something that we had never seen before: a basis blowout so extreme that it restructured all that we know about inventories, futures contract spreads and supplier basis-diffs.

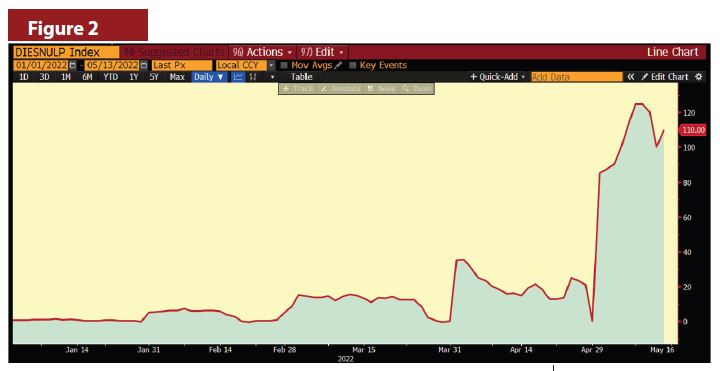
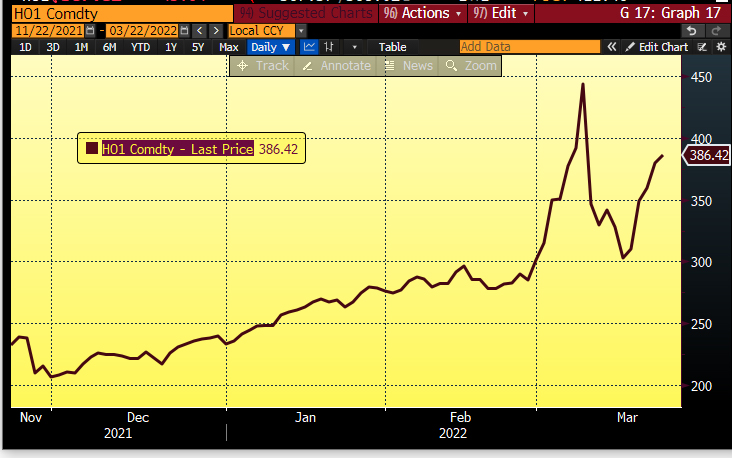
Once the prices spiked last April (see Figure 2), the combination of (a) supply uncertainty and (b) a belief/wish that “all this would soon go away” drove “spot” prices (spot prices, such as those in the New York Harbor physical markets are truer indications of suppliers costs, and accordingly, rack and basis-diff costs) up dramatically and left futures prices at a discount to the spot markets, but not by a few cents. Not by a few dimes, either. The NYH-Merc basis moved out to $1.25 per gallon, well different from the historical average of less than a penny. Ever since the Spring of 2022, we have had futures prices in “backwardation,” where each successive month is less expensive than the one before. In plainest English, it means that physical supply is expected to consistently drop in value over time. That is a recipe for low storage inventories. Who wants to own/hold an asset that is losing value? You need to think deflation as opposed to inflation.
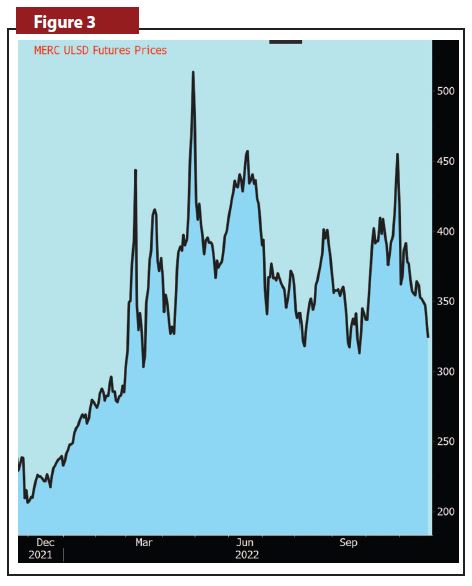
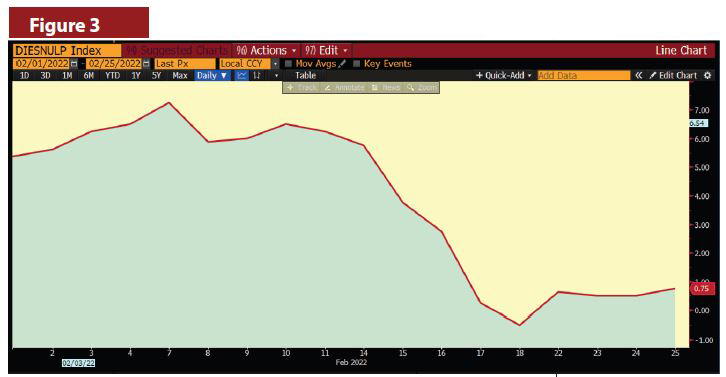
While we had this backwardation over the Summer (see Figure 3), we also had suppliers that were quoting, if at all, seemingly egregiously high basis-diffs for their clients (the heating oil dealers) who wanted to lock in diffs. If there was any good news over the Summer, it was that the basis blowout—spot versus Merc—seemed to have reverted back to its normal boring self.
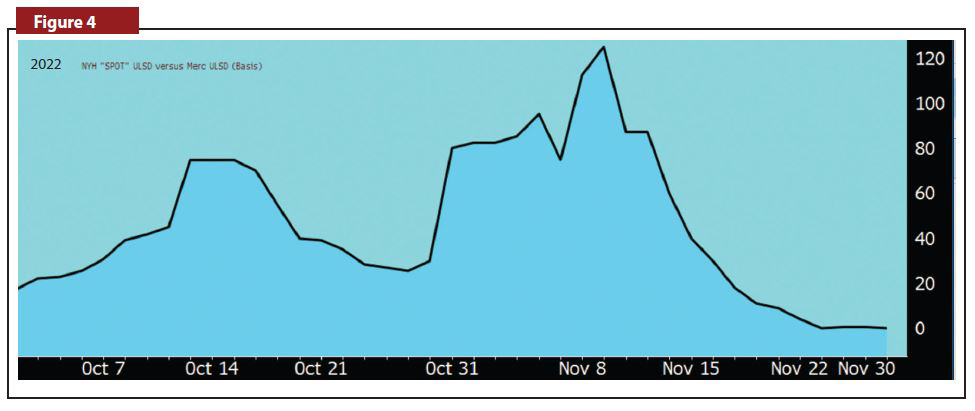
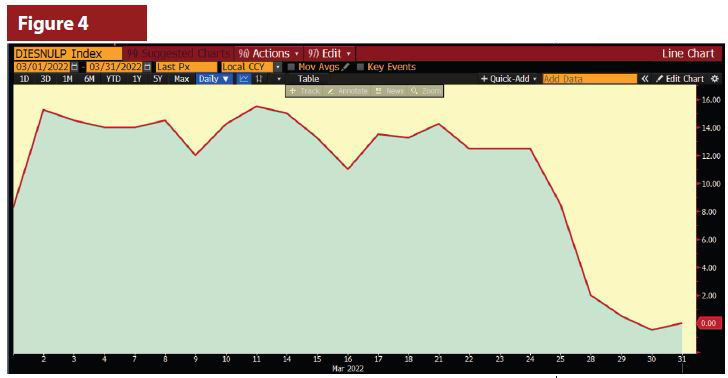
And then October came! In October, the basis spread moved up to about $.75/gallon and then in November it moved up (again) to $1.25/gallon (see Figure 4).
The hope that it was just a one-time occurrence was quickly dispelled. Inventories remained bare, backwardation remained in place and supplier-diffs were still very pricey (note that this article is being written at the beginning of December 2022).
In the future, when the oil market insanity of 2022 is debriefed, there will be a lot of finger-pointing at Moscow and Vladimir Putin. However, a closer look will reveal a lot of other things that have been bubbling up over the past number of years, finally reaching a boiling point—the anti-fossil fuel lobby has led to declining investments in oil production and an absolute curtailment of the building of refineries, all while demand for energy has been increasing. Mixed messages from the U.S. administration about pipeline approvals and the need for more oil production don’t help matters. Worldwide political struggles will always overwhelm the myopic position that the U.S. is a self-sustaining energy producer.
Inventory, suppliers, Greenification, politics, etc. We didn’t start the fire; it was always burning since the world’s been turning. Perhaps we have been lucky that we didn’t have basis blowouts until now.
The three takeaways that we have from this past year are:
1. If you want to keep your customers, you need to protect them from extreme price movements.
2. The larger the swing in prices the more important it is to offer caps rather than fixed prices.
3. Basis protection is no longer a “nice to have” but something that you must have.
You can hedge the basis with supplier diffs (if you can find fair ones), you can hedge with paper hedges (either fixing of capping the basis) or you can pray that 2022 was a total one-off any won’t happen again. What you can’t do is be surprised again. Fool me once, shame on you. Fool me twice, shame on me. ICM
PAST RESULTS ARE NOT NECESSARILY INDICATIVE OF FUTURE RESULTS.
The risk of loss in trading commodity interests can be substantial. You should therefore carefully consider whether such trading is suitable for you in light of your financial condition. In considering whether to trade or to authorize someone else to trade for you, you should be aware that you could lose all or substantially all of your investment and may be liable for amounts well above your initial investment.
Savvy fuel dealers have long been aware of the dollar value of a heating degree day to their business. With this realization, many have purchased a weather-hedging product over the years to protect their vital margin in the event materially warmer-than- normal weather could impact a heating season. Most of a typical company’s fuel and service costs are fixed in nature. However, 2022 has introduced a wave of inflationary factors that have driven up these fixed costs, effectively loading up each heating degree day your company will experience this Winter with heightened significance.

In addition to the fuel and equipment supply issues, which have escalated the cost of goods sold just as we approach the peak heating season, expenses associated with payroll, insurance, repair, maintenance and fuel have notably mounted. The borrowing costs associated with tanks, inventory and customer receivables are expected to grow markedly this Winter if the current pricing trend persists.
Many will-call customers may opt to order only the bare minimum needed to make it through the Winter, yet your fixed costs continue. In the span of less than a year, the earnings burden on each heating degree day between November and March has become far more pronounced than at any other time in recent history. With these pressures, it stands to reason that target margins on fuel sales, service and installation can and should be raised, but that “X-factor”—the weather—still looms.
Weather-impacted business
This leads me to the odd question posed at the outset. With each of this coming Winter’s precious heating degree days now stacked higher with the costs of operating your business, have you paused to determine your company’s true required weather-driven earnings?
Fortunately, by using your budget or even last year’s results (if you have opted to navigate these unprecedented times without a forecast), a reliable figure can easily be assessed. While fuel oil and propane deliveries are most obviously impacted by warmer than normal weather, our clients’ experiences show service and installation activities tend to fall as well during periods of material warmth. Therefore, it pays to assess your reliance on each weather-impacted business line.
To many, weather hedging remains a bit of a mystery; however, it is merely a financial tool designed to replace some or all of the lost profitability that would otherwise have been earned in a “normal” heating season. By isolating the most weather-dependent gross profits and comparing them to the expected heating degree days for the same period, a gross profit per heating degree day target can be determined and used to establish protection.
Weather hedges are derivatives and can be structured in a variety of ways and at different protection levels, but the most typical approaches are designed for monthly or seasonal protection. Your commodity trading advisor can assist you in finding the approach that best suits your risk and discussing the costs associated with each approach.
As the recessionary indicators mount, increased bank scrutiny of borrowers’ 2022 financial results is likely to follow. For companies that seek to take advantage of acquisition opportunities, maintaining consistent performance is paramount. Lost heating degree days are shaping up to carry an outsized impact on financial performance this heating season.
Take the time to assess the full weight of what each heating degree day will mean to your company this year. By exploring the tools available to you to help insulate your company during this tumultuous time, you very well could eliminate the need for even heavier decisions next year. ICM
Jeffrey Simpson is the Managing Director of Angus Finance and acts as an advisor to the fuel industry in the areas of hedging, budget preparation, cash flow management, capital structuring, acquisitions, the location of financing and banking negotiations. He can be reached at 860-299-3358 or jsimpson@angusenergy.com.
PAST RESULTS ARE NOT NECESSARILY INDICATIVE OF FUTURE RESULTS. The risk of loss in trading commodity interests can be substantial. You should therefore carefully consider whether such trading is suitable for you in light of your financial condition. In considering whether to trade or to authorize someone else to trade for you, you should be aware that you could lose all or substantially all of your investment and may be liable for amounts well above your initial investment.
Picture this. You sold your customer a capped price of $2.99 per gallon for the winter. Your supplier sells you oil at a price of $2.00 per gallon on a day that the CME pricing (the “Merc”) is $1.90 per gallon. You turn around and sell it for a price of $2.99.
Then a few days later, the Merc is at $1.65 per gallon, but your supplier is still at $2.00 per gallon. You might frown, but you would pay $2.00 and sell it for $2.99. Then a few days later, the Merc is at $1.35 per gallon, but your supplier is still at $2.00 per gallon. You might frown even more, but you would pay $2.00 and sell it for $2.99.
The basis—effectively the spread between the Merc price and your supplier’s price (the “Rack”)—moved, but the customer just paid you your full margin. To a customer, the “basis” means nothing.
Now let’s turn that into the current reality. When dealers offer a price to a customer, capped or fixed, the calculation likely included:
*Merc price (fixed or capped)
*Basis (fixed or floating)
*Profit margin
For the past 10–15 years, the basis has not been a high item on people’s radar. Sure, it was always there, and sure there were ways to hedge it with suppliers or with a trading counterparty, but it was definitely a bit out of sight, out of mind. Companies fell into several categories relative to the basis:
1- Supplier-locked diffs at some point during the summer (with two subcategories)
a. Locked in for most/all of supply
b. Locked in for most/all of the program gallon supply
2- Hedged the basis via “paper” (i.e., a basis swap) leading up to the locking in of the supplier diffs
3- Didn’t hedge or lock the diff because they liked to shop around and didn’t find the basis to be a major concern
Basis versus Merc is somewhat akin to New York Harbor (the “Harbor”) versus Merc. Therefore, according to the “transitive law,” Rack versus Merc is similar to Harbor versus Merc. If there is a blowout in the Harbor versus the Merc, it will lead to a basis blowout at the rack. That is what happened this year, after spending years moving by only a relatively small amount—note the range from
-$.0750/gallon to +$.0400/gallon. Figure 1
Russia then decided that it needed to attack Ukraine and jeopardize the world’s supply balance of oil, causing total disarray and a spike in the “near-term” pricing—and widening of the Harbor to Merc spreads. Note that since January, the spread range (which, over the five prior years was less than $0.12 cents/gallon), is now over $1.25/gallon. Figure 2
The basis blowout has caused program sales gallons to be delivered to customers in May at a net loss to dealers in many cases. Racks have remained somewhat steady with the Harbor, but the blowout between the Harbor and the Merc has led to some serious concerns and sleepless nights as we prepare for this coming year (and years into the future):
1- Will my supplier offer me a fixed-diff for next year?
2- If so, why are they telling me “Not yet?”
3- Also, if so, how high will that diff be?
4- If I haven’t considered locking in a diff, should I?
5- If I should, can I?
6- If I am nervous, is there another approach?
Root cause of blowouts
After studying the movements on the Merc, the Harbor and at the Racks, we believe that we have identified most of the root cause of the blowouts (in addition to suppliers just taking advantage of the situation, and there is nothing wrong with grabbing some extra money when it is available. Heating oil dealers do it all the time!)
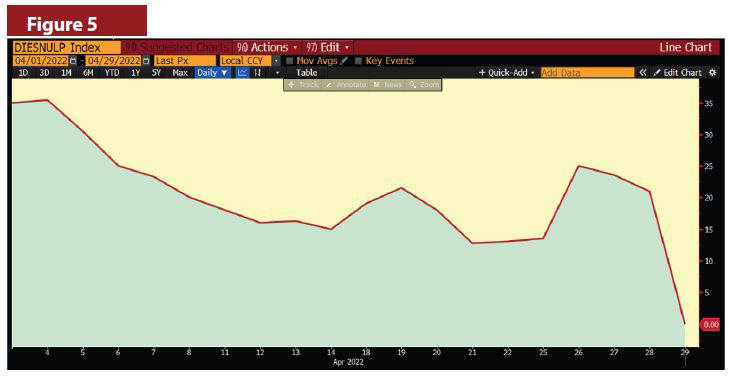
Combining two theories that we both believe are true, we believe a “proxy” exists to curb further basis blowout in the short-term and in total for next Winter. Theory 1 is that, as each month ebbs to a close, the cash market and futures market prices converge. That means that someone owning a futures contract at the end of the month can (technically) accept delivery of that product in the following month. Accordingly, the spread between the Harbor and the Merc tends to narrow down as the month comes to a close (see Figures 3, 4 and 5 focusing on February, March and April and how that diff narrows).
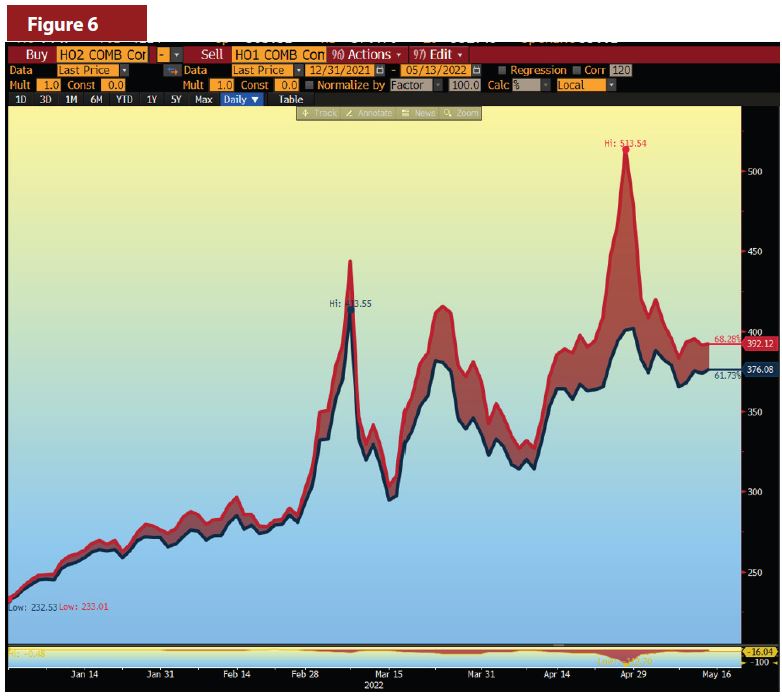
Theory 1 is that since the month ends with the basis pretty close to zero, but we are also seeing some wide Harbor to Merc spreads early in months (painfully so), the pain must be caused elsewhere. Theory 2 is that when the market senses that I need supply now, but in the following month things will be better than today (exactly what we witness in the current “backwardated” market), the spread between two futures contracts will have blown out.
Figure 6 shows how those two contracts (Merc contract 1 and Merc contract 2) track each other and can become totally un-tethered.
A hedge plan may well address the basis blowout through a planned series of spread trades, if appropriate for you. We would assess the volumes that you plan to sell monthly, discuss the amounts that are subject to basis risk (in many cases it might be all gallons), compare the “what ifs” and make a hedging plan for your consideration. Leaving the basis spread as something that doesn’t matter is no longer a viable option.
Remember, customers don’t care about basis, but to you it might mean everything. ICM
PAST RESULTS ARE NOT NECESSARILY INDICATIVE OF FUTURE RESULTS.
The risk of loss in trading commodity interests can be substantial. You should therefore carefully consider whether such trading is suitable for you in light of your financial condition. In considering whether to trade or to authorize someone else to trade for you, you should be aware that you could lose all or substantially all of your investment and may be liable for amounts well above your initial investment.
On the last day of 2021, the price of West Texas Intermediate (WTI) crude oil futures closed at $75/barrel (bbl). About 10 weeks later, the price had risen to over $90/bbl, and then just 10 days after that, prices traded over $130/bbl. In a 10-day period in February, ultra-low sulfur diesel (ULSD) futures rose from $2.85/gallon to over $4.50/gallon—an increase of more than 55%.
Industry veterans like to play it cool with pithy remarks about how prices always rise and fall, but eventually calm returns to the market. While that might be true, those veterans are likely not dealing with customers wondering why costs have jumped $2.00/gallon since their last delivery, or with banks and suppliers not willing to increase credit lines in the middle of Winter, nor with customers who don’t feel very motivated to pay a $900 oil bill in March when they won’t be due for their next delivery until September. Sure, calm might return to the market, but where does that leave you now and for next Winter?
Here are a few things we have seen & believe to be true:
Customers do not like surprises
For a reason that continues to confound all of us, customers seem to believe that:
A. Dealers make more money when prices rise and
B. Dealers wait until prices are high before making a delivery
Part of the solution to these two misconceptions is simple education of both your customers and your customer service representative (CSRs) in order to explain to your clientele. However, the notion of customers not liking surprises is completely limited to high prices. Customers like falling prices and they love low prices. You must educate them that you are on the same side as they are—you hope for low prices, but sometimes high prices are a reality. They also need to understand that sometimes prices swing uncontrollably (e.g., due to COVID-19, the Russian invasion of Ukraine, etc.).
Banks & suppliers like rules and can be rigid to deal with
Banks and suppliers are well aware that oil prices move. It is likely that they are following oil price gyrations much closer than you are. However, the credit lines they have set for you are dollar denominated, not “gallon denominated,” and the rules related to your credit are not that flexible.
If you have $1 million of credit and prices double, it will seem as if your credit has been cut in half—because it has! Unless you have a special relationship with the lender, changing terms in the middle of a crisis can be very difficult and potentially quite expensive. There are limits as to what you will be able to do to get more credit from lenders, but this should be another reminder that budget plans and pricing programs can be serious mitigators of cash-flow crises.
If you can’t control your margins, you can’t control your profits
This year, we witnessed an attitude among some dealers that they would and could “suck it up” and not increase sales prices in response to the spike at the rack. While that might seem noble, it is not your responsibility (unless you want to jeopardize your financial future).
Your automatic delivery customers agreed to pay whatever price you charge them for a delivery. That might work this year, but if your last delivery of the year is $2.00/gallon higher than the earlier deliveries, customers will remember that—and there will only be one place to point fingers (no, not the Kremlin nor the White House).
Achieving your per unit margin is what keeps you in business. Setting your pricing properly is the only way you achieve that. Additionally, as prices (and margins) sometimes seem uncontrollable, you must control your costs, other than what happens with the global price of oil. Basis and weather are often overlooked as risks, and usually do not cause major profit challenges, but when they do (e.g. basis blowout, frigid or balmy weather while prices are moving more than usual), the impact can be very large.
Pricing programs used to be “nice to have,” but no longer
If you do not offer a program, customers will (assuming they can afford to) pay your retail price. However, when those prices rise and fall wildly, it is not surprising that loyal customers are suddenly not so loyal. If you do not offer an alternative to “pay the market price,” someone else will. If you don’t think that customers are going to shop around for a Pricing Program after this Winters’ violent price swings, you may be in for a rude awakening.
Fixed prices are better than no program, but are too risky
Should prices fall precipitously between the time you lock in your customers and the next Winter rolls around, you might be facing some uncomfortable conversations. Customers will, undoubtedly, remember that you told them to lock in their price with you (while no such thing actually happened).
Our suggestion is to communicate all the rules regarding fixed prices, explain what happens if prices rise or fall, and if possible, this is the year to only sell fixed prices via a pre-payment. Yes, your customers are all credit-worthy, but trying to collect $5.50 per gallon if retail prices fall to $2.50/gallon might not be so easy. If you are going to offer a fixed price and you are getting pre-paid, you should be able to achieve your margin goals. However, offering fixed prices can lead to some serious retention challenges.
Capped prices establish a price ceiling, yet allow prices to fall
Capped prices are expensive! Let’s address the elephant in the room: the costs to hedge (generally through a strategy of options to cap prices) are higher than we have seen in a very long time, possibly ever. While you intuitively understand that, it can be hard to pull the trigger on buying the price protection. Is the timing right? What if prices fall tomorrow? Can I really charge or pass through such a high cost without losing customers? These are all real and valid questions.
If you think about it, you are doing something akin to buying hurricane insurance the year after a bad hurricane season. Sure, everyone wants and needs the insurance, but the premiums have jumped significantly. Our feeling is that you need to share your thinking with your customers. You didn’t cause the markets to fluctuate; you didn’t cause the cost of “insurance” to go up; and you are only there to help protect and service your customers in the best way you know how. The other part—which is part of a much more detailed discussion that you should have with your registered Trading Advisor—is trying to find the cost/benefit balance in setting your cap level, because the higher the cap, the less expensive the cost to put that cap in place. Is there a real difference to a customer between a cap of $4.50 versus $4.75? Maybe yes, maybe no. How much can you save by offering a higher cap? These questions, and more, must be part of the Advisory conversation.
Don’t panic
This March was an anomaly on a historical basis. Yet it did happen and we can only play the cards we are dealt. Next Winter’s prices are (as of this writing) cheaper than the prices we see today. Accordingly, you do have some flexibility in how you approach your pricing programs. More than anything, you need to plan, not spend your day guessing, hoping and reacting to things beyond your control.
Recap
You make money when you get full margins and when your customers stay with you. The only real way to have that happen is to carefully plan it out rather than “do what I did last year” and hope it works out for you. Understanding what you can and cannot control is the first step in getting where you need to be.
Price volatility, regulatory attacks on our industry, questionable abilities for customers to pay their bills and operating a business in a suboptimal way are our realities. Burying your head in the snow and hoping that the next generation will figure it out is not the right approach. Use the tools that are available, starting with the tool between your ears. Accept that you don’t know what will happen and accept that you can still do something about it. ICM
PAST RESULTS ARE NOT NECESSARILY INDICATIVE OF FUTURE RESULTS.
The risk of loss in trading commodity interests can be substantial. You should therefore carefully consider whether such trading is suitable for you in light of your financial condition. In considering whether to trade or to authorize someone else to trade for you, you should be aware that you could lose all or substantially all of your investment and may be liable for amounts well above your initial investment.
With all due respect to REO Speedwagon, the band’s 1981 #1 hit “Keep On Loving You” pops into my head every time I hear a client tell me about the time and effort they spend adjusting (just a few) Ks (K-factors, the calculations that show how quickly a home is consuming the fuel it uses to produce heat). We have all faced times where the Ks just don’t look right, and in many cases, we just don’t want to wait for the back office system’s (BOS) correct formula to catch up with the actual heating degree day (HDD) vs. consumption calculation.

What if the calculation wasn’t the problem?
Allow me to paint a picture for you with two examples based on weather and associated consumption for two sets of your customers:
Scenario #1: You have customers at 1 Main Street, 2 Main Street and 3 Main Street
You fill all three customers’ tanks on Feb. 1 and again on Feb. 22, each fill is 201 gallons. During this time period there were 806 HDDs.
On Mar. 27, each of the three customers receives another delivery (of different amounts).
• 1 Main Street: 202 gallons
• 2 Main Street: 135 gallons
• 3 Main Street: 98 gallons
During this time period (Feb. 23–Mar. 27), there were 809 HDDs.

Scenario #2: You have additional customers at 4 Main Street, 5 Main Street and 6 Main Street
You fill all three customers’ tanks on Jul. 1 and again on Dec. 22, each fill is 200 gallons.
During this time period (Jul. 1–Dec. 22), there were 1,596 HDDs.
On Jan. 17, each of the three customers receives another delivery (of different amounts).
• 4 Main Street: 99 gallons
• 5 Main Street: 132 gallons
• 6 Main Street: 198 gallons
During this time period (Dec. 23–Jan. 17), there were 791 HDDs
What happened & what changes would you make?
The problem with K-factor accounting (or consumption) is not that the homeowners are misbehaving. It is not that they suddenly expanded their houses or went to Florida for a few months. It is not that the BOS doesn’t know how to do math.
The problem (and it seems to apply to most customers) is that the notion “x HDDs = y gallons of consumption” is only true in the middle of the winter. If the heating system is on for the entire period in between deliveries, then a “true K” can be calculated. However, once you peek outside of the middle of the winter and include additional days in your calculations, all bets are off.

Let’s shed light on the “mysteries” above. Scenario #1 looks like three houses with four Ks, 806 HDDs and 200 gallons of consumption—this is pretty straightforward. What happened after the next 800 HDDs? Shouldn’t there have been ~200 more gallons of consumption? Maybe the customers didn’t really consume a gallon for every four HDDs? The answer is that, indeed, these customers do consume one gallon each time there are four HDDs. They have a (usage) K of four. However, while Customer #1 kept the heat “on” all the way through the delivery date of Mar. 27, Customer #2 shut the heat off on Mar. 14 (the first warm day of early Spring) and the HDDs from Mar. 14–27 didn’t cause any fuel consumption. Furthermore, Customer #3 followed the path of Customer #2, but took a vacation starting Mar. 7 and only consumed fuel until that date, resulting in consumption that was limited to ~100 gallons.

The issue was not the K, it was whether the heating system was on
Scenario #2 appears to any outsider as a customer with a very high K. It took 1,596 HDDs to consume
~200 gallons. Lacking any other information, this looks like a K-factor of eight. Why then did the next delivery to the three customers look so different from each other? Is the K of these neighbors really an “8”?
The answer is almost the polar opposite (pun intended) of Scenario #1. Customer #4 had the heat on during the entire period from Jul.1–Dec. 22 and consumed 200 gallons. From Dec. 23–Jan. 17, the 791 HDDs caused consumption of 99 gallons, due to their K of eight. Customer #5 has a K of six but didn’t turn the heating system on for the winter until Oct. 31, consuming 200 gallons from then until Dec. 22. From Dec. 23 through Jan. 17, Customer# 5’s K of six resulted in consumption of 132 gallons. Customer #6 put on the heat around Thanksgiving (Nov. 24) and has a K of four, resulting in a 200-gallon delivery on Dec. 22 and a great Jan. 17 delivery of 198 gallons.
While hindsight is 20/20, we need a way to forecast tank levels, not a way to backtrack and figure out why things didn’t turn out as expected. Each time a delivery is made, the BOS uses its rearview mirror and adjusts. The adjustments are logical, and they are conservative—as they should be. If consumption exceeded expectations, the K will drop (by a formulaic amount). If consumption was less than expected, which is a much more frequent occurrence, the K will rise, but disproportionately from the lowering of the K (to avoid the increased likelihood of a future runout).
If you, as an owner or a dispatcher, are not pleased with the tempo of the “formulaic changes of the K,” you would join the club of “K changers” (you know who you are!) and would manually make some changes—almost always more aggressively than the BOS formula, and often an overreaction. For those interested in the psychology of manual changes vs. formulaic changes, look up the term “Recency Bias”—it will explain a lot about human nature!
Are remote monitors the only solution?
Simply put, each day a monitor will report how much fuel is in the tank. Armed with that information, and the proper delivery planning, you should avoid delivery surprises. Take note that not every 200-gallon delivery is optimal. There is a lot more to “optimal” than simply the size of individual deliveries, but we will leave that discussion for another time. The purpose of the monitor is to know the size of the delivery you will be making.
However, monitors cost money. In most cases there is an ongoing monitoring fee (ADEPT alert: we have a program that waives 100% of monitoring fees). Monitors take time to install and not every monitor reports every single day. If monitors, installation and monitoring were free, you would have them on 100% of your tanks; if they cost thousands of dollars for a residential tank, you would have them on 0% of your tanks. Cost effectiveness is directly related to the benefits that can be achieved—not only the “knowing,” but the value of knowing. Better put, monitors should be on the tanks where the delivery size is unknown. For tanks where you do know the delivery size, and there are many of them, you may be better off without a monitor.
How do you know which is which? As always, the answer is in your data. Analyzing your deliveries can be a manual process or an automated process (like many other things). It can be based on averages, histograms, standard deviations, etc. We prefer to point out extremes after we analyze data. We start at opposite ends of the spectrum (I was reluctant to use the term “polar opposites” again). We would tell you which tanks need monitors the most and which need them the least. Working from both ends towards the middle has the effect of driving your “average predictability” up in an accelerated manner. If you find your biggest outliers (formulaically), each tank to which you add a monitor will provide a bigger benefit than the one that follows.
Summary of key points:
• Everyone hates run-outs
• Homeowners turn their heating systems “on” and “off” in unpredictable ways
• Deliveries are generally smaller than anticipated
• Ks adjust conservatively by their formulaic nature
• Manual adjustments are often overreactions
• Monitors are not needed on all tanks
• Selection of which tanks benefit the most from monitors can be automated. ICM
As we enter 2022, the No. 1 answer to the question—What would make you sleep better at night?—is almost always—More drivers!
Driving a truck went from a decent way to earn a living to a job that is highly compensated, yet few have an interest in pursuing. The existing workforce is aging out and is being replaced by a new generation whose top request is: Can I work remotely? This puts a career of driving a truck way down on their list of career choices, regardless of compensation.

This question has captivated the country as we emerge from the COVID-19 pandemic and are faced with multiple supply-chain issues. Even if we can find what we need, how do we get it from “there to here?”
The answer is simply more drivers, right? Maybe not. What if you already have more drivers (and trucks) than you need? Now you can sleep better at night, right?
As an industry, we have generally solved process problems by hiring more people:
• We need to make more deliveries. Hire more drivers.
• We need to do more cleanings. Hire more service techs.
• We need to send out more bills. Hire more clerical workers.
We have become so used to solving current challenges with solutions of the past that we don’t even consider our own goals. The goal of an oil company is (typically) to deliver fuel to customers at a competitive price that will generate sufficient profits. To achieve this, operations must run smoothly, efficiently and optimally.
We want to define “optimal” in our industry as: Using required resources, including equipment and people, in the most efficient manner to deliver all required gallons with an acceptably low risk of run- outs.
Though it is hard to argue with that definition (those readers who disagree can skip the rest of this article and go directly to the ads for testing kits and fuel additives), a reasonable disagreement can arise as to how to accomplish that optimization.
Bottom-up or top-down?
If you know your average delivery size, then you know how many deliveries you need to make over the course of the year. If you know how many stops you make in a typical day, you know how many dispatched trucks you need to have over the course of the year. If you know what your peak needs are (January), and you know your average delivery size, then you know how many trucks and drivers you need in January.
Once all that is known, you have set the number of trucks you must own and can spend the rest of the year juggling how many full-time drivers you need and how many part-time drivers you can get away with. That is bottom-up planning—starting with average delivery size and the peak demand, and then letting the rest fall into place. Top-down planning starts with the bigger picture:
• How many gallons can you get out of a truck?
• How many gallons per stop can you average?
• How many stops can you make in a typical day?
Instead of letting history dictate what you can and cannot do, we prefer to rely on data to inform us of what we should do.

• The data says your average deliveries are well smaller than your optimal (targeted) delivery size, and your deliveries in the Summer, despite a far lower concern of run-outs, are well smaller than those in the Winter. The reasons can be complex, but the data shows the reality and shows how to increase those towards your optimal.
• The data shows >95% of your tanks (of the same size) have the same reserve level every day of the year regardless of the tank-owner’s consumption. You set up your reserves to protect against run-outs in the winter, but have no mechanism to target larger deliveries in the Spring, Summer and Fall.
• The data shows your delivery trucks operate at ~40% efficiency (on the road only 100 out of 250 workdays per year), with a subset only being used for a couple of weeks per year. Expanding deliveries into shoulder months (when temperatures outside sit comfortably between 45–65°F)—especially before the season—can increase the number of days on the road, increase the annual volume per truck and create excess capacity in the winter by flattening the peak.
You could use an adding machine, but you choose to use a spreadsheet. You could use a walkie-talkie, but you choose to use a cell phone. You can try to keep your profits where you want them by constantly raising your prices to offset your increased operating expenses—or you can realize that data and processing power can combine to lower your delivery costs in a substantial way.
You don’t earn your profits per delivery; you earn them per gallon. Doesn’t it make sense to use the information you already have to lower your operating costs per gallon?

You don’t need more drivers, a.k.a. higher expenses. You need to make the most of what you have—and the most is a lot more than you think! ICM
The heating oil industry isn’t the same as it was a generation ago. The heating oil industry is the same as it was a generation ago. This simple, yet confusing, dichotomy is at the heart of all changes that can be considered.
Technology continues to forge forward, bringing better, cheaper and smarter ways to communicate with customers, plan deliveries and manage expenses. However, as our industry is still a hands-on customer-centric one, we need to continue to differentiate in an era where differentiation has become quite difficult.
If you ask 10 dealers the top reasons for customer attrition (and customer growth, for that matter), somewhere in the top three will always be a mention of “price.” Yes, customers like prompt service. They like budget plans, and having a tank monitor and an app is always a plus. However, if you really want to cut down on attrition, you need to be sure that the price you charge is not too high. You don’t have to be the low-price leader, but even the biggest and best-run companies have come to the stark realization that “heating oil is heating oil,” and that their customers will only pay so much for a “premium brand.”
Pricing programs
Although pricing programs have been around since the early 1990s, they remain a steadfast part of the value proposition for many dealers, and one that customers rely on each year for a measurement of certainty. At the beginning of January of this year, we had missile attacks by the U.S. on an Iranian leader, followed by Iran firing missiles in the general direction of U.S. military facilities in Iraq, with the world ebbing closer to a possible war in the heart of the world’s major oil-producing region. “World War III” was trending on Twitter and the U.S. Selective Service website crashed from too much traffic.
How high did oil prices spike? Don’t you mean how much did they fall? Yes, oil prices fell during that week of extreme tensions!
Did they fall because the temperature in New York hit 65°F in early January? Did they fall because tensions with the Iranians (temporarily) eased? Did they fall because Organization of the Petroleum Exporting Countries (OPEC+) plans to stick to their quotas this time? Who knows, and does it really matter? The simple truth is that oil prices are as hard to predict as they ever have been, and considering that rising prices cause customers to shop around, addressing price increases is, has been, and always will be a part of a dealer’s life—if the dealer wants to keep customers from shopping around.
Now that we are in a new decade, we can look back at the past one and have 20/20 hindsight. In the first half of the previous decade, heating oil futures regularly traded above $3.00 per gallon (with retail prices often above $4.00 per gallon). At the beginning of the second half of the decade (early 2016), heating oil prices fell to under $1.00 per gallon, just to triple in the next 33 months. Seeing prices move by 25¢, 50¢ or 75¢ per gallon over the course of a year is something that we pretty much take in stride; however, with the ability to shop around being greater than ever, how do we keep our customers happy?
How customers shop
With all the sophistication that comes into play regarding offering pricing programs, and hedging the risk to assure the earning of a reasonable margin, there are pretty much only three ways that customers buy oil. Each has benefits and drawbacks, both on the margin side of the ledger and on the customer retention side.
Regardless of your preferred method to hedge the risk of a price cap, knowing that regardless of where prices are heading next month, next year and for the rest of the new decade, you will be able to keep your price-related attrition under control, and might be the best way to keep your business thriving. The time to start planning for a price cap offering is generally in the spring.
Your best customers will be on a budget plan, with a service contract and a remote tank monitor. Don’t lose that most valuable asset (the customer) over something like a severe swing in prices when you can protect yourself and your customers by offering a cap. ICM
As insurance rates keep going through the roof (if you can even find someone willing to write a policy for you), the notion of having “those extra trucks” is facing more scrutiny than ever before. The theory that the older, “paid for” trucks were good to have around is flying in the face of the questions over the real costs to have some extra trucks for deliveries that just might (or might not) be needed. At a cost of $150,000 for a new truck, it is well understood that new truck purchases (leases, etc.) need to be carefully thought through, but we don’t see the same sharpening of the pencil when it comes to the size of the delivery fleet. The notion that “more is better” needs some investigation.
Of course you need enough trucks to handle all of your deliveries. You also have to consider the number of trucks that will be needed for your peak delivery days in the middle of the winter. But what is the right number? Is it “X trucks” per customer? Per gallon? Per heating degree day (HDD)?
We asked a number of owners and dispatchers a simple question: How many gallons does a truck deliver per year? Interestingly, many of those asked seemingly heard, How many gallons can a truck deliver per year? To that question, we often got responses of about a million gallons. So, that was our starting point—a truck can deliver a million gallons. Does it make sense? It definitely does. If you figure that a truck delivers about 4,000 gallons on a regular/busy day, and then consider that there are roughly 250 delivery days per year, the math is pretty simple:
4,000 x 250 = 1,000,000
However, not all trucks are delivering every day. Actually, most trucks are not even used every day. We surveyed a group of our clients and tracked the usage of 780 trucks over the course of the year. We looked at the number of days they were used, the number of stops, the number of gallons and the number of miles.
On average, a truck is delivering fewer than 500,000 gallons annually—not the million gallons that they can deliver. The average truck is on the road fewer than 800 hours per year, or about 40% of the time. It does make sense when you consider that for about half of the year, say May–September, almost all of your trucks are sitting around not doing anything.

What is the best way to maintain a fleet – get rid of old vehicles or
keep extra ones on-hand? Author Phil Baratz has suggestions.
As I walked through Boston’s Logan Airport last month, I noticed a quote on one of the rotating advertising screens at my gate: Data is out. Answers are in. Though I cannot take credit for the line, I was sure that it succinctly said everything we’ve been preaching for the past year—and I embraced it!
Data is everywhere. It is in our back-office accounting systems (BOS). It is in our business intelligence reporting tools. It is in our tank-monitoring data and it is in the reporting we get from our “Big Brother” driver analytics. There is a notion that data is the true commodity and will lead to profits and success—while partially true, it is also partially false. Just having access to information does not, by itself, lead to better decisions and greater profits.

Data is only valuable if it can be used.

Amidst change, changing behavior can be more difficult than altering business operations.
It seems that technological changes are coming at us at the speed of, well, technology—from an app to deliver food to your door within minutes of your order, to the latest innovation that keeps your car in its lane while also keeping it a safe distance from the car in front of you. In ICM’s world, technology includes onboard computers, remote tank monitors and parts inventory management systems. In all cases, the technology was way out in front of the behavior, but eventually those who would benefit from the technology adapted to it and reaped the benefits.
We sometimes like to be nostalgic and think about the “simpler times” in our industry, when a handshake was a contract, attrition only happened when a home was sold and you didn’t have to compete against an online discount marketer. The truth is that, for the past 50 years, the most successful companies took advantage of an innovative technology very soon after it became available.
Many of us are starting to see around the bend as to the power of technology, and we—willingly or begrudgingly—are starting to accept that things are going to be different in three, five and 10 years from now. However, most of what will be “usual and customary” in five years is actually available now—if only we could change the way we act. Changes to behavior are hard to accept—and even harder to force others to implement.
Stocking the shelves
Due to the resistance to change, many in the technology world surpass the roadblocks to simply go out and get the job done. The largest retailers used to have inventory sheets on clipboards to track when replacement inventory needed to be ordered. Then there was an automated system that tracked sales at the checkout register and presented a report to the purchasing manager. That was better, but took time to adopt. Now, the purchasing manager—to his or her benefit—is totally skipped over, as automated inventory systems also act as automated inventory replenishment systems linked directly to suppliers. That is how Wal-Mart, Target and Starbucks keep supplied.
Fuel distributors, a.k.a oil dealers, are starting to look at their delivery businesses as inventory management systems. In this case, inventory is the oil in your customers’ tanks, and effective management is ensuring those tanks don’t run out. That is the way we have operated for decades. However, thanks to technology, we can start to bypass some of the human systems (changes in behavior) and realize tremendous savings from operating more efficiently.
The back-office accounting systems (BOS) that are used in our industry are excellent at what they do with regards to setting up deliveries according to the needs of the individual customer. The relationship between the BOS and the experienced dispatcher create the unique DNA that makes our ecosystem work. With the advent and adoption of remote monitoring and routing software, dispatchers are starting to look better—and be better.

Fuel oil managers are starting to look at supply and demand as an inventory system.